Running the AWS XRay Daemon
Introduction to AWS X-Ray
AWS X-Ray helps developers analyze and debug production, distributed applications, such as those built using a microservices architecture. With X-Ray, you can understand how your application and its underlying services are performing to identify and troubleshoot the root cause of performance issues and errors.
X-Ray provides an end-to-end view of requests as they travel through your application, and shows a map of your application’s underlying components. You can use X-Ray to analyze both applications in development and in production, from simple three-tier applications to complex microservices applications consisting of thousands of services.
AWS X-Ray Daemon
The AWS X-Ray daemon is a software application that listens for traffic on UDP port 2000, gathers raw segment data, and relays it to the AWS X-Ray API. The daemon works in conjunction with the AWS X-Ray SDKs and must be running so that data sent by the SDKs can reach the X-Ray service.
To run the X-Ray daemon locally, on-premises, or on other AWS services, you need to download it from the AWS X-Ray Daemon support page, run it, and then give it permission to upload segment documents to X-Ray.
Giving the daemon permission to send data to X-Ray
The X-Ray daemon uses the AWS SDK to upload trace data to X-Ray, and it needs AWS credentials with permission to do that.
On Amazon EC2, the daemon uses the instance's instance profile role automatically. Locally, save your access keys to a file
named credentials in your user directory under a folder named .aws.
Example ~/.aws/credentials
[default]
aws_access_key_id = AKIAIOSFODNN7EXAMPLE
aws_secret_access_key = wJalrXUtnFEMI/K7MDENG/bPxRfiCYEXAMPLEKEY
Running the daemon
Run the daemon locally from the command line. Use the -o option to run in local mode, and -n to set the region. The download page linked in the text above gives specific instructions on how to run the daemon on supported operating systems.
For the MacOS distribution, the command is as follows (assuming the AWS London region is being used): -
~/Downloads$ ./xray_mac -o -n eu-west-2
X-Ray daemon logs
The daemon outputs information about its current configuration and segments that it sends to AWS X-Ray.
2016-11-24T06:07:06Z [Info] Initializing AWS X-Ray daemon 2.1.0
2016-11-24T06:07:06Z [Info] Using memory limit of 49 MB
2016-11-24T06:07:06Z [Info] 313 segment buffers allocated
2016-11-24T06:07:08Z [Info] Successfully sent batch of 1 segments (0.123 seconds)
2016-11-24T06:07:09Z [Info] Successfully sent batch of 1 segments (0.006 seconds)
Adding AWX X-Ray Support to the codebase
AWS X-Ray support is enabled through the inclusion of the stacks-module-parent dependency that imports the Spring Cloud
support for AWS; at some point the use of AWS- and Azure-specific libraries are to be tidied up, so it is likely that at
that point a specific AWS module will need to be included.
The code currently uses Spring AOP to add a pointcut to all Controller methods under the com.amido.stacks package so no
manual intervention is necessary.
It is possible to enable (or disable) AWS X-Ray support using the following environment variable prior to starting the application: -
export AWS_XRAY_ENABLED=true
The AWS X-Ray SDK will fail quiescently if no authentication is provided, or if the Daemon is not running. Please check the output of the X-Ray daemon logs initially (see above) if traces do not seem to be arriving in CloudWatch.
Viewing X-Ray Traces in the AWS Management Console
Once the daemon has been setup and started any REST API controller methods should start to push trace information to the AWS Management console for the account whose credentials are being used.
Open the AWS Management Console and navigate to the CloudWatch section. On the toolbar on the left you should see a section entitled X-Ray traces.
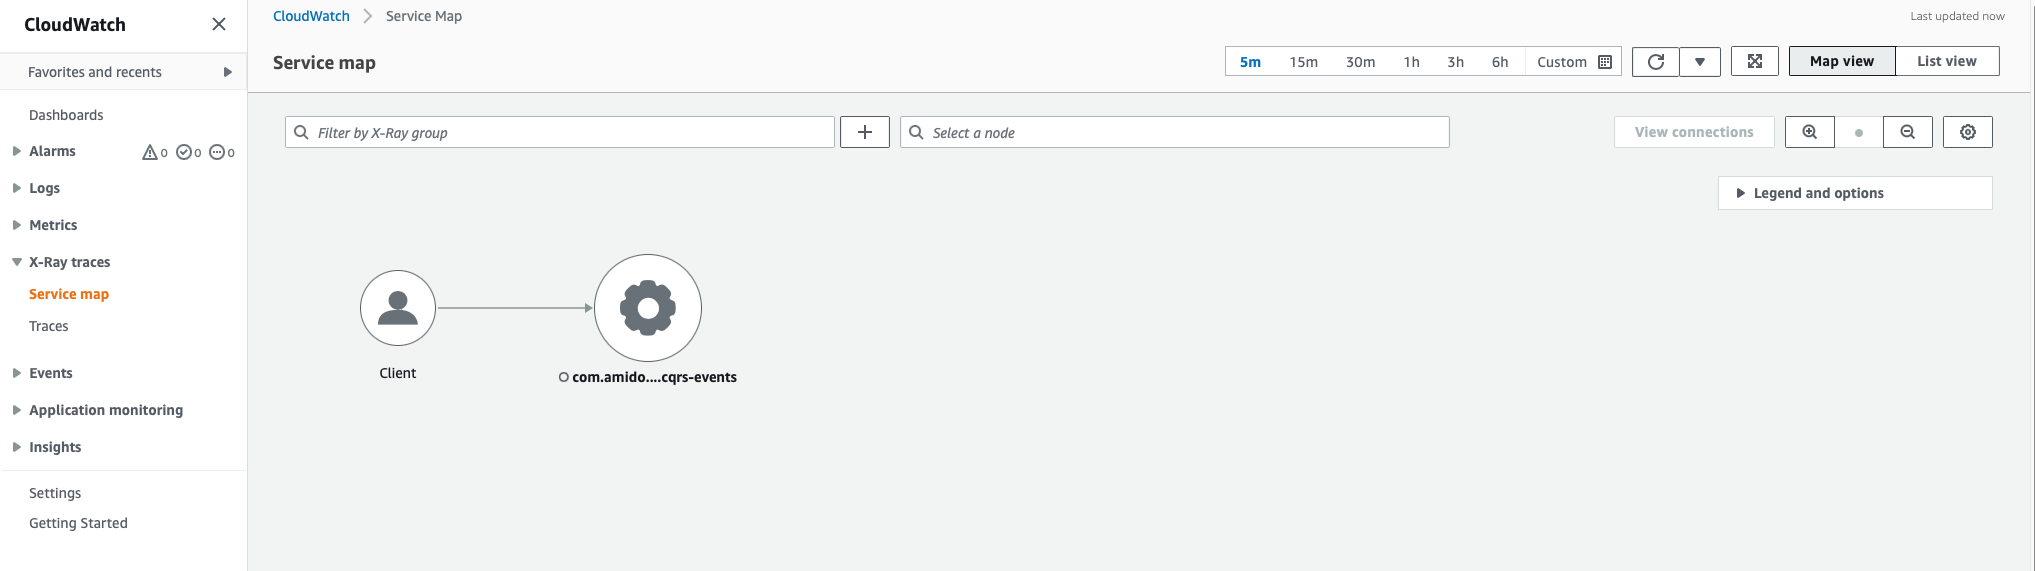
Expand this section and choose the Service map option. You should start to see information about REST API calls that have been made - you can click on the Traces entry to see more detailed information.
Example Service Map
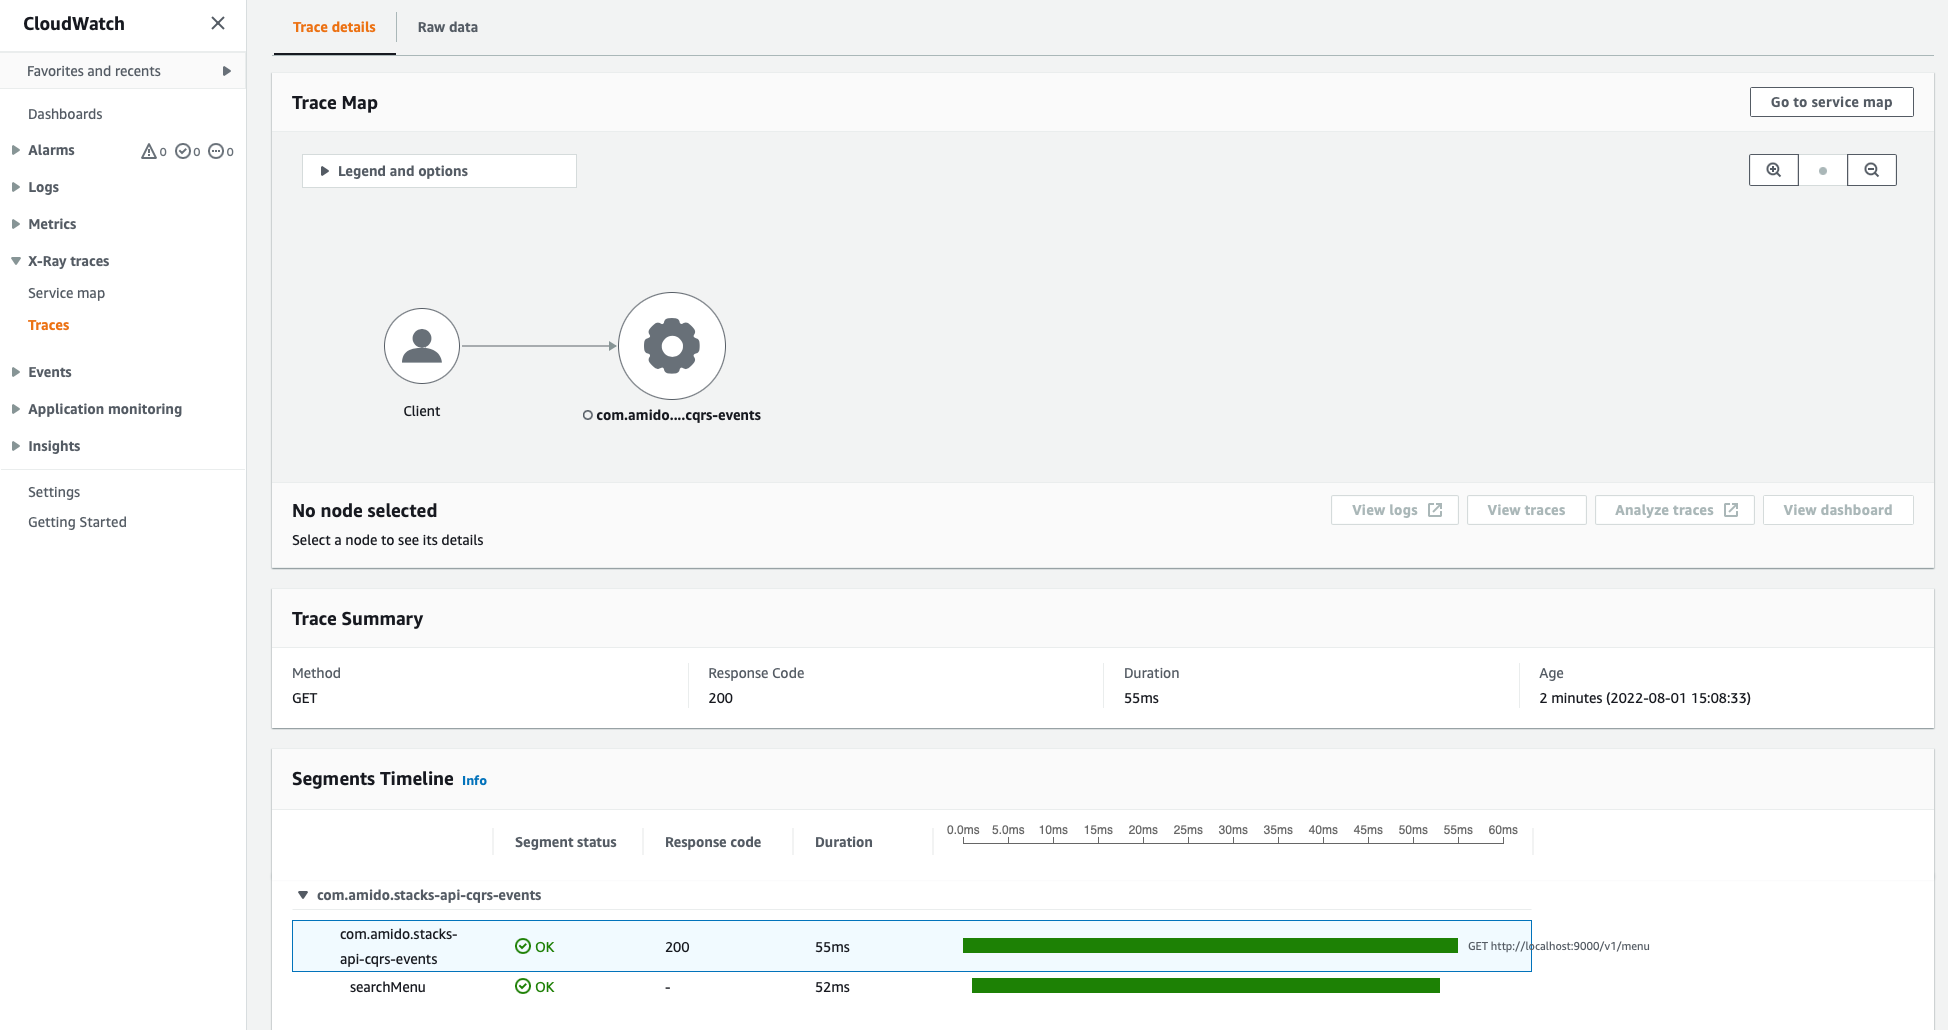
Example Trace
Handling X-Ray Segment Errors
If the STS call is made before a request actually comes into the X-Ray enabled service (or out of band of the request), this will cause a missing context exception.
AWS advise to either omit any calls that aren't part of the request path
(using an un-traced AWS client) or set the AWS_XRAY_CONTEXT_MISSING env variable to LOG_ERROR - see X-Ray Env Vars.
Normal calls to X-Ray as part of a request operations are not affected by this setting.
An example of this type of error is as follows: -
08-08-2022 09:46:16.279 [main] |  |
        WARN  i.a.c.s.AwsSecretsManagerPropertySources.logTo - Unable to load AWS secret from /stacks-secret/example-1/.
              Failed to begin subsegment named 'AWSSecretsManager': segment cannot be found.
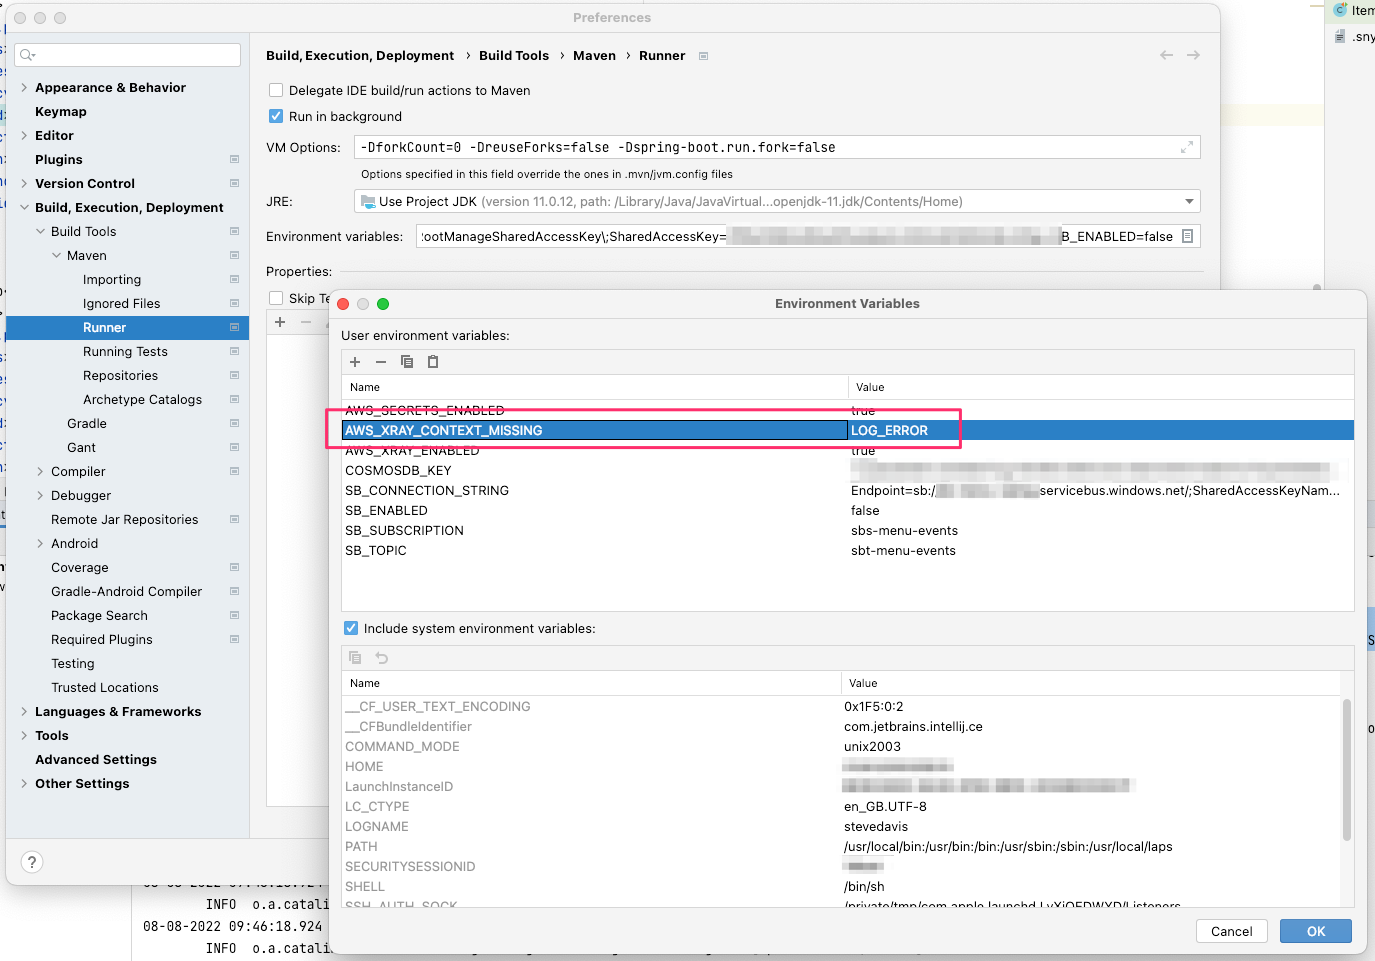
The recommended course of action is to set the AWS_XRAY_CONTEXT_MISSING environment variable - if using Intellij IDE
this can be done by easily by setting the environment variable in the Maven Runner environment variables section. If using
Docker or Kubernetes it is recommended that the relevant functionality be defined to set this variable (such as config maps).